


Your marketplace just closed Q4 with $50 million in Gross Merchandise Value (GMV)—a 40% quarter-over-quarter surge. The executive team celebrates, but when examining the P&L statement, net revenue is only $6 million.
Against that $50M in platform throughput, the business earned a 12% Take Rate (platform commission). In the prior quarter, $35M in GMV yielded $5.25M in revenue—a 15% Take Rate. While transaction volume exploded, actual business earnings barely budged because growth was driven by aggressive fee waivers, buyer coupons, and subsidized shipping.
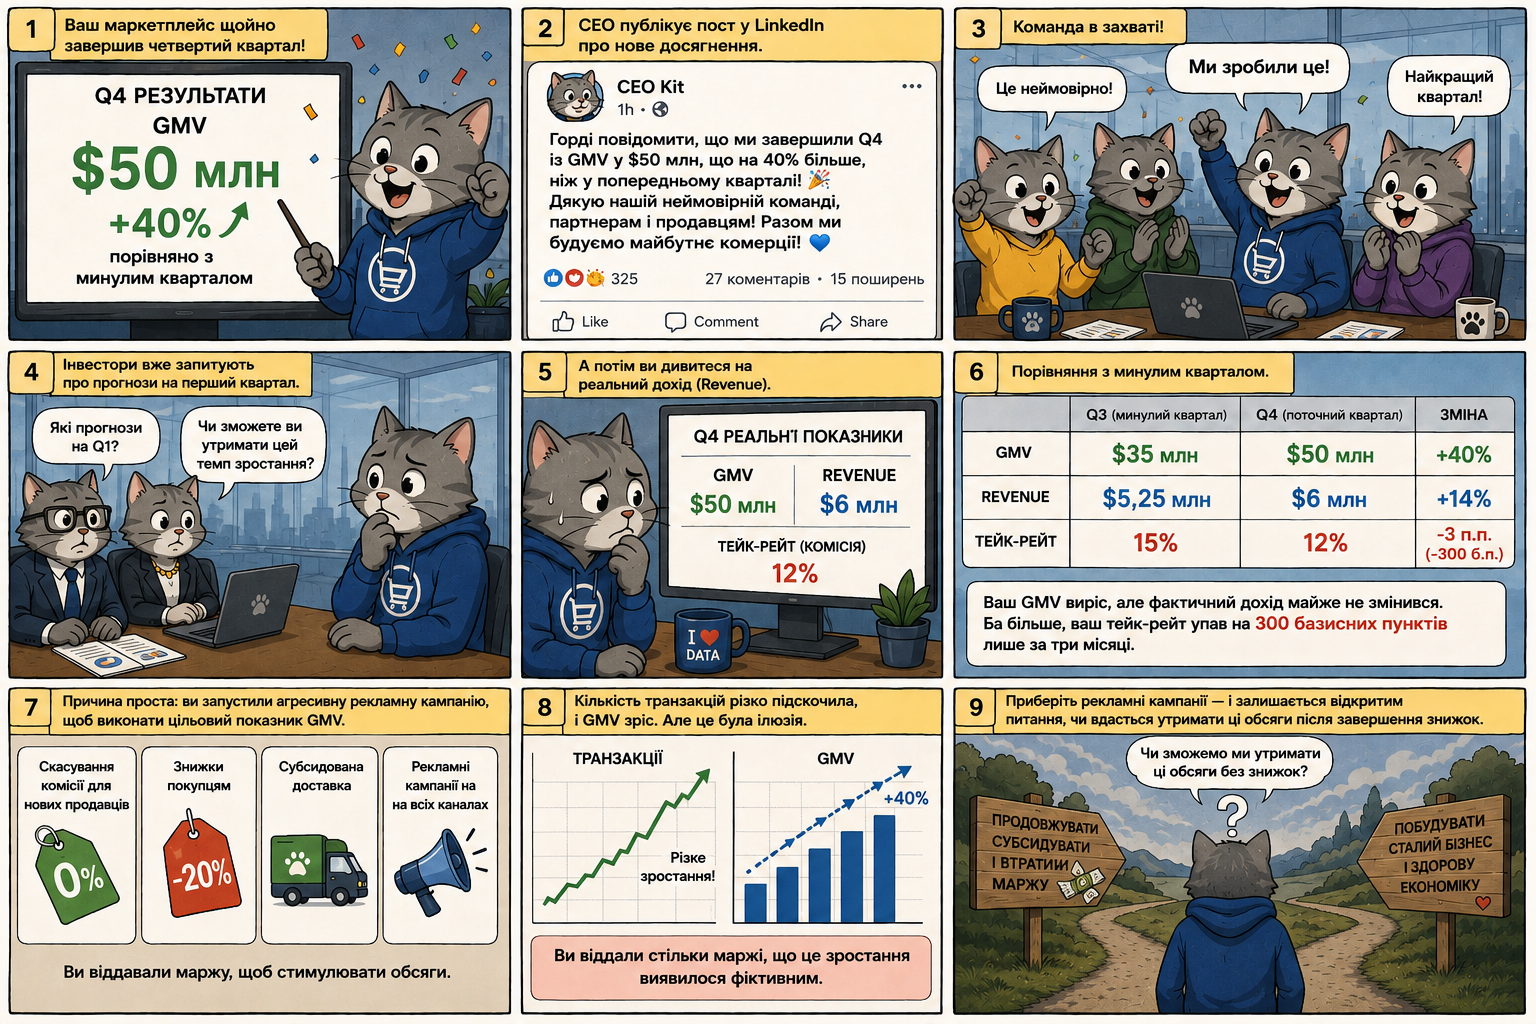
This is the classic "GMV Trap": high transaction volumes create the appearance of rapid growth, but raw transaction flow does not translate directly to cash flow or profitability.
GMV vs. Take Rate vs. Net Revenue
- Gross Merchandise Value (GMV): The total dollar volume of transactions executed across your marketplace. GMV serves as a proxy for platform scale, consumer demand, and market liquidity.
- Take Rate (Platform Monetization): The percentage of each transaction retained by the platform (transaction fees, merchant listing fees, buyer service charges, advertising).
- Net Revenue: The actual top-line revenue earned by the platform: Revenue = GMV × Take Rate.
Core Formulas & Calculation Methodology
1. Gross Merchandise Value (Gross GMV)
Sums all gross merchandise sales executed through the platform during the reporting period:
$$ \text{GrossGMV} = \sum (\text{ItemPrice} \times \text{UnitsSold}) $$
💡 Example: If 500 products sell at an average price of $100 alongside 200 premium consulting packages at $250, total Gross GMV = $100,000.
2. Net Gross Merchandise Value (Net GMV)
Calculates real completed transaction volume after deducting canceled orders, refunds, and payment disputes:
$$ \text{NetGMV} = \text{GrossGMV} - \text{Returns} - \text{Cancellations} - \text{Chargebacks} $$
Net GMV provides the true economic base for revenue recognition under ASC 606 and reliable cash planning.
3. Marketplace Take Rate
Measures platform monetization efficiency:
$$ \text{TakeRate} = \left( \frac{\text{PlatformRevenue}}{\text{GMV}} \right) \times 100 $$
If a marketplace processes $1,000,000 in GMV and captures $140,000 in net fees, its Take Rate is 14.0%.
4. Unit Economics: Contribution Margin per GMV
To assess the variable unit economics of platform throughput, deduct payment gateway processing costs and variable support from gross commission:
$$ \text{ContributionMargin} = \frac{\text{PlatformRevenue} - \text{PaymentProcessingFees} - \text{VariableCosts}}{\text{GMV}} $$
Industry Take Rate Benchmarks
| Platform Model / Sector | Typical Take Rate Range | Primary Monetization Mechanisms | Benchmark Examples |
|---|---|---|---|
| On-Demand Food Delivery & Quick Commerce | 15% – 30% | Restaurant commissions + consumer delivery fees + advertising | Uber Eats, DoorDash, Glovo |
| B2C & C2C Consumer Goods | 8% – 18% | Transaction take rates + seller listing subscriptions + sponsored listings | Amazon Marketplace, eBay, Etsy |
| Freelance & Digital Services | 10% – 20% | Dual-sided buyer/freelancer commissions + premium placement | Upwork, Fiverr |
| B2B Wholesale & High-Ticket Marketplaces | 3% – 8% | Low percentage transaction fees or tiered fixed-fee structures | Faire, ACV Auctions |
Common Pitfalls in GMV & Take Rate Management
- Booking Total GMV as Revenue on the P&L
- ❌ Mistake: Recording $10M in processed third-party orders as direct company revenue, artificially inflating corporate size.
- ✅ Best Practice: Record only the earned net commission ($1.2M at a 12% take rate) under agent accounting standards (ASC 606).
- Overlooking High Return and Cancellation Rates
- ❌ Mistake: Relying on Gross GMV for financial projections in high-return categories like apparel, where return rates can exceed 30%.
- ✅ Best Practice: Model financial forecasts strictly on Net GMV.
- Subsidizing Growth via Unprofitable Incentivized GMV
- ❌ Mistake: Offering platform-funded discounts and shipping subsidies to hit GMV vanity targets before investor meetings.
- ✅ Best Practice: Separate organic GMV from subsidized GMV to track true cohort retention and customer lifetime value.
- Ignoring Merchant Payment Processing Costs
- ❌ Mistake: Treating a 10% gross take rate as platform profit without deducting 2.5% in merchant interchange fees.
- ✅ Best Practice: Analyze Net Take Rate and transaction Contribution Margin after card processing costs.
- Failing to Segment Take Rates Across Categories
- ❌ Mistake: Blending low-margin electronics (3% fee) with high-margin fashion (18% fee) into a single aggregate metric.
- ✅ Best Practice: Maintain category-level GMV tracking to spot unfavorable mix shifts early.
How to Track GMV and Take Rate in Nomi
Marketplaces require rigorous accounting separation between merchant settlement funds and platform revenue.
The Nomi financial operating platform automates platform accounting:
💡 Key Advantage: Nomi automatically separates passthrough merchant settlement funds from retained platform commission revenue, delivering accurate P&L statements and preventing treasury confusion.
Nomi Capabilities for Platforms and Marketplaces:
| Objective | How Nomi Solves It | Business Outcome |
|---|---|---|
| 🔄 Passthrough Fund Separation | Automatically isolates Gross GMV, Net GMV, and platform commission under agent accounting standards | Audit-compliant P&L without inflated top-line figures |
| 📊 Take Rate & Contribution Analytics | Computes true Contribution Margin after merchant gateway fees, promo discounts, and refunds | Crystal-clear visibility into category profitability |
| 📅 Seller Disbursement Sync in Calendar | Maps merchant payout schedules against collected transaction settlements | Elimination of liquidity crunches during vendor settlement cycles |
| 🔮 Scenario Modeling in Cash Flow | Simulates cash positions under fluctuating take rates, merchant subsidies, or return surges | Confident, data-driven budgeting for marketplace growth |